Variable names in concrete data:
Cement
BlastFurnaceSlag
FlyAsh
Water
Superplasticizer
CoarseAggregate
FineAggregate
Age
CompressiveStrength
Concrete data Summary
summary(concrete)

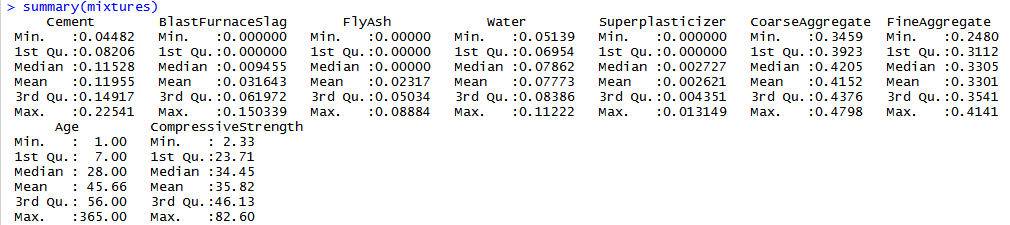
Mixtures data Summary
summary(mixtures)
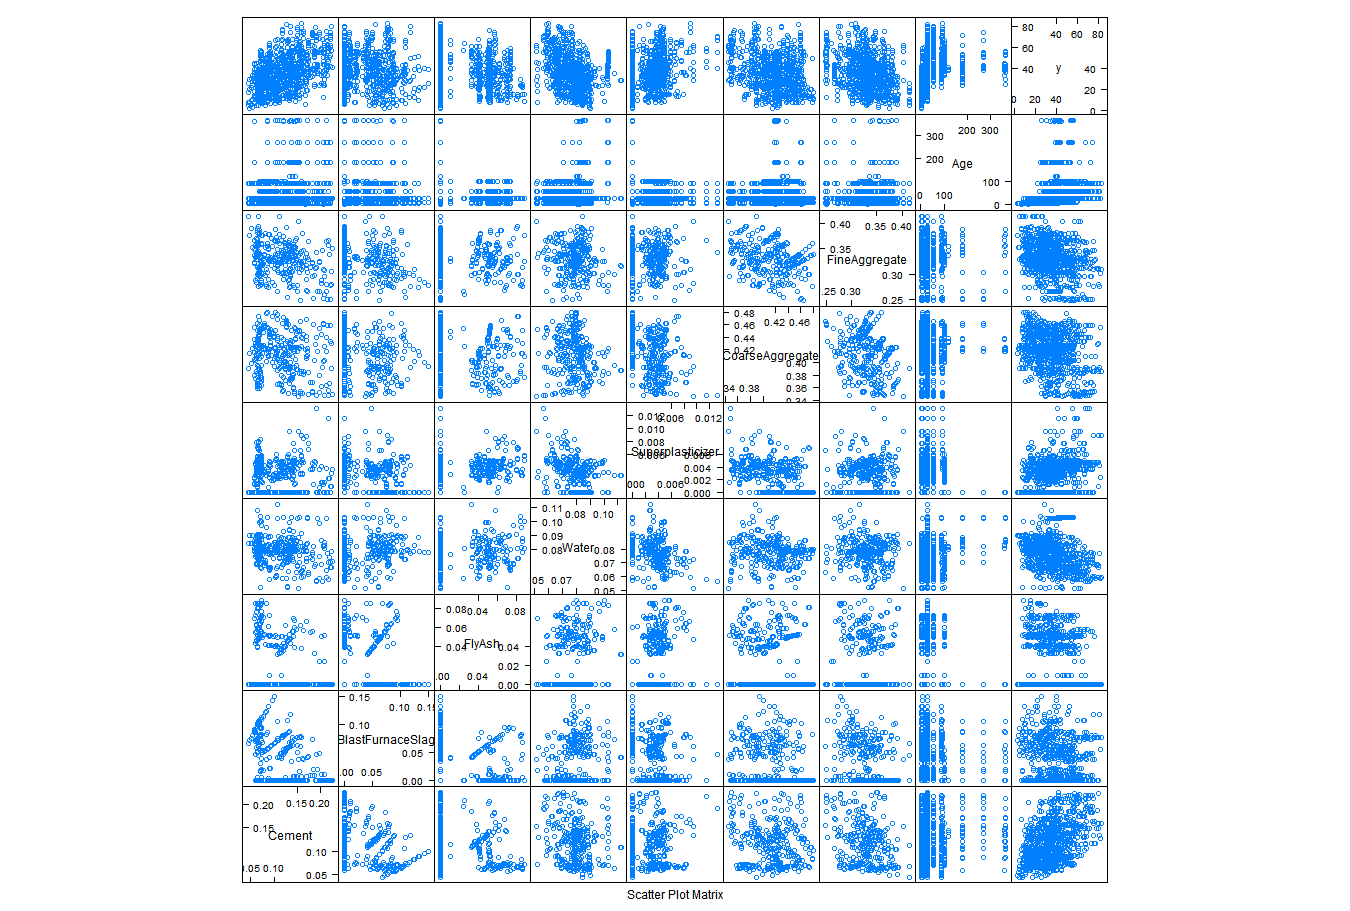
Mixtures data Feature Plot
requires library(caret)
We could list out all the variable names as shown below:
featurePlot(x=mixtures[,c(“Cement”, “BlastFurnaceSlag”, “FlyAsh”, “Water”, “Superplasticizer”, “CoarseAggregate”, “FineAggregate”, “Age”)],y=mixtures$CompressiveStrength, plot=”pairs”)
or simplify a bit:
names <- colnames(mixtures)
names <- names[-length(names)]
then plot:
featurePlot(x = mixtures[, names], y = mixtures$CompressiveStrength, plot=“pairs”)